How we use Mimer Metrics in our agency
 We built Mimer Metrics to help cut down on the hours spend reporting and explaining the numbers to our AdWords clients.
Digging out data on a case by case basis and then seeing the client not really caring about the answer is both time consuming and frustrating. Ugh!
To make things easier, we now use Mimer Metrics for reporting. Here’s a run down of the steps we take from new client to a lasting relationship with repeat business.
Starting out with a new client
First step is finding out what needs the clients have. We do Google Analytics, Facebook ads, Bing and Google AdWords so often the client needs to have us look over their Google Analytics account and determine where to start what metrics to focus on and what goals to set.
I’m not going into the nitty gritty here, only enough to explain how we cut a lot of friction and non-value adding work.
The basic setup – dashboards
In Mimer Metrics we start by connecting to the Client’s Google Analytics account and setting up a basic dashboard.
Here we use our pre-made “General overview”. We set comparison to last month to see changes in traffic, goal conversion etc. If it’s seasonal dependent work the client does, we compare to same month last year. Sometimes this gives a better understanding. Again it depends.
When done we share the dashboard with the relevant employee at the client’s company. In this case our primary contact is a project manager. Someone who doesn’t need the deep understanding for each area, but still needs to have the general overview (hence the dashboard name. Clever, right?).
We make dashboards as needed for each person at the company. AdWords overview, developer etc.
We want to make specialized dashboards for each employee dependent on what our work will be. That way the employee (or client in general) only have a few metrics to look at to follow along. The benefits are:
- They actually look at the numbers
- They only see what they need to judge our work
Saves us time and highlights our results. Nice!
Dashboards are a great supplement for reports, because you always have the current status through the shared link instead of a static report.
This can handle some of the questions that can come throughout the month if a specific metric needs to be checked. It also gives us a quick view and helps us stay focused on the numbers that matter.
Setting up automated reports
Right, we now have shared dashboards for the day-to-day work. Now we can refer to them instead of using time digging into the data and sending e-mails.
Next up we have reports.
We want to set up a report for accountability. We set the report to be sent on the first of each month with only the few most relevant metrics. We want to keep it short and sweet.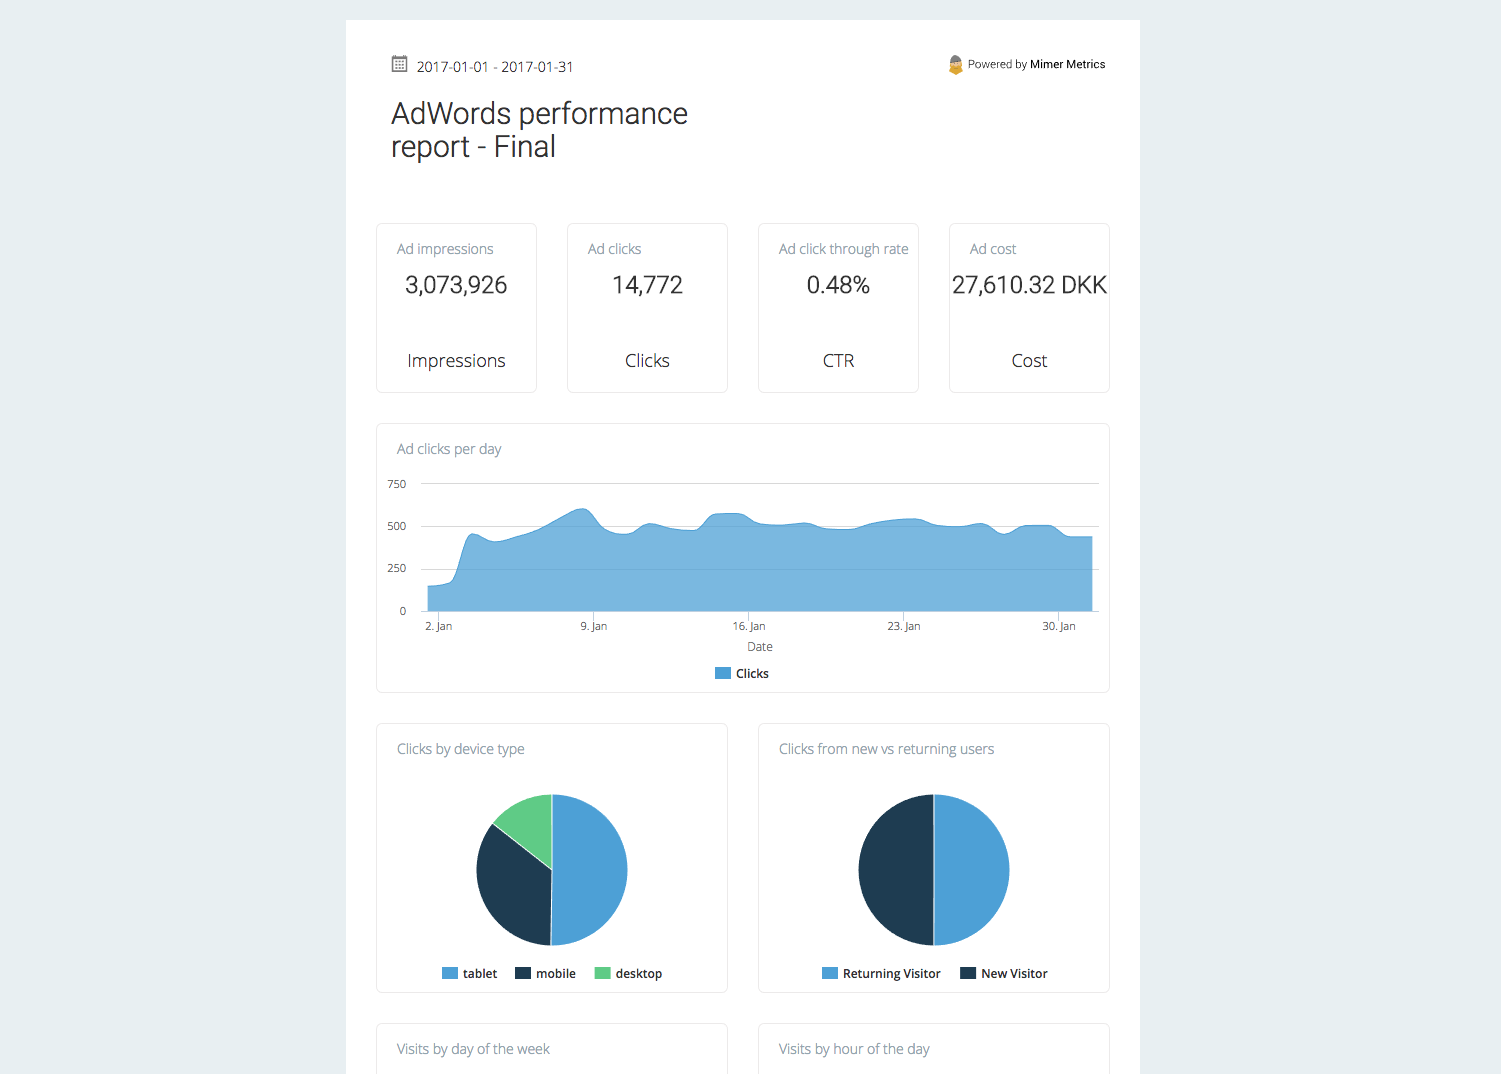
In reports we place text widgets to explain each table, pie chart and line graph. We need to tell what’s important and what it means.
The client needs that aha! experience. To know that a positive trend = more money. This will highlight the value we add during the month.
Reports are also for clients who are more passive or not hands-on during the month. Some clients just want to see the status and not spend time talking about it, so we don’t want to spam them with extra data.
On the other hand, we still want to check in with the client to keep them in the loop. It’s important to show our value each month.
Once set the report will be sent out automatically each month without you doing anything. Saving you hours of work.
Hope you can use this approach in your own business. It’ll save you a lot of time and frustration!
 GET HAPPIER CLIENTS